Forecasts [24th of Mar'25]
PSI, AI, & quantitative Crypto & SPX ST forward price biases

*None of this is to be construed as financial advice. I am doing this purely out of curiosity and for fun.
PSI forecast
The forecast is meant for the coming 24hours, and applies to Bitcoin, Ether, and Solana coins
Prices at the time of forecast production:
BTC: $87,809
ETH: $2,068
SOL: $140.07
SPX Close: 5,767.57
Definitions:
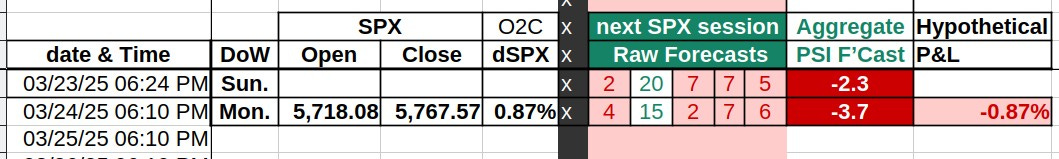
The raw forecasts will range from 1 to 20, using a 20 sided die.
The Aggregate Forecast is the average of the raw forecasts minus 10.5.
A positive Aggregate Forecast is bullish for the next Open to Close Session (9:30AM to 4PM ET, SPX)
A negative Aggregate Forecast is bearish for the next Open to Close Session (9:30AM to 4PM ET, SPX)
A positive Aggregate Forecast is bullish for the next 24hours (Crypto)
A negative Aggregate Forecast is bearish for the next 24hours (Crypto)
dSPX (O2C): these are log percentage changes in respective price from the latest Open to Close values.
Formula: dSPX= ln[(Last Closing Value) / (Open Value)]
Daily Price Changes: these are log percentage changes in respective price from the previous forecast to the time of the latest forecast.
Formula: dailyPriceChange= ln[(current Price) / (Price at previous forecast time)]
Hypothetical P&L: These are the hypothetical trading profit and loss with respect to the previous forecasts, BEFORE considering explicit or implied transaction costs.
Formula:
if (PreviousForecast > 0){dailyPriceChange}else {-dailyPriceChange}Means: Average hypothetical daily P&L from the psi forecasts, assuming we got long if forecast was bullish, and short if forecast was bearish.
Count: Number of hypothetical trades taken from psi forecasts
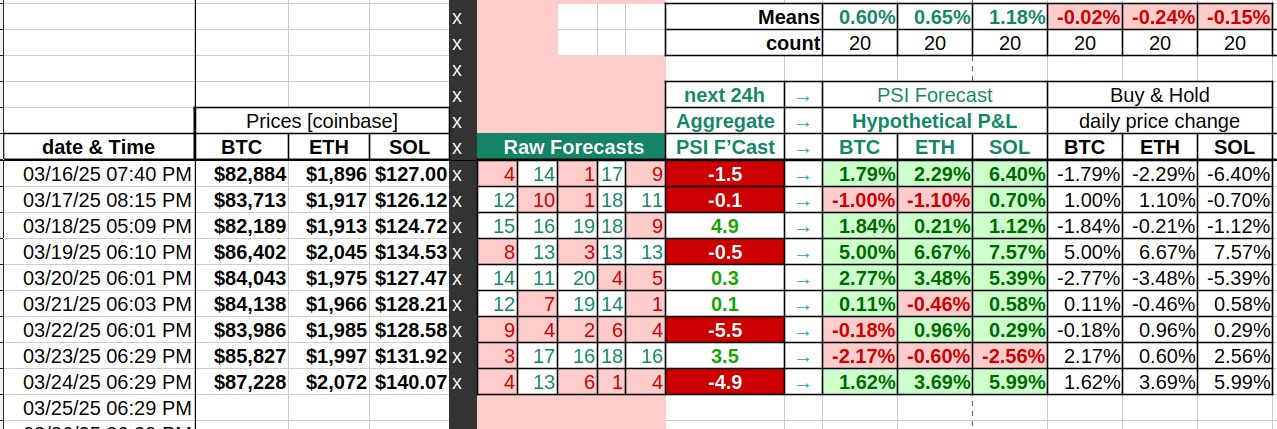
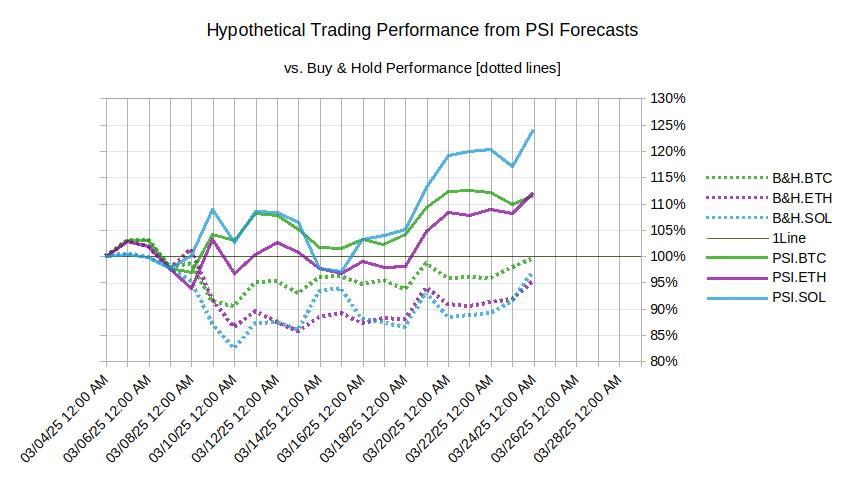
Latest PSI Forecasts & Performance
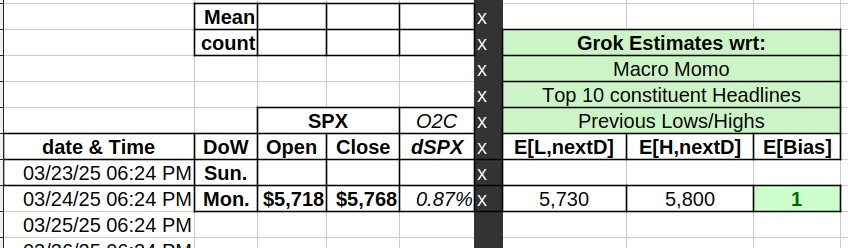
SPX
Crypto
AI forecasts
AI Method
I will be using GROK for these forecasts, and I am starting with the SPX.
Factors to be utilized by AI while making the forecasts:
Short term macro momentum, e.g. expectations around changes in nominal GDP growth and inflation
Sentiment from news headlines of the top 10 weighted SPX constituents
The forecasts will be presented in the following way:
+1 = bullish from last closing value to the closing value of next day
0 = neutral/uncertain from last closing value to the closing value of next day
-1 = bearish from last closing value to the closing value of next day
*I have also asked it to provide an estimate off the next session High and Low, just for kicks.
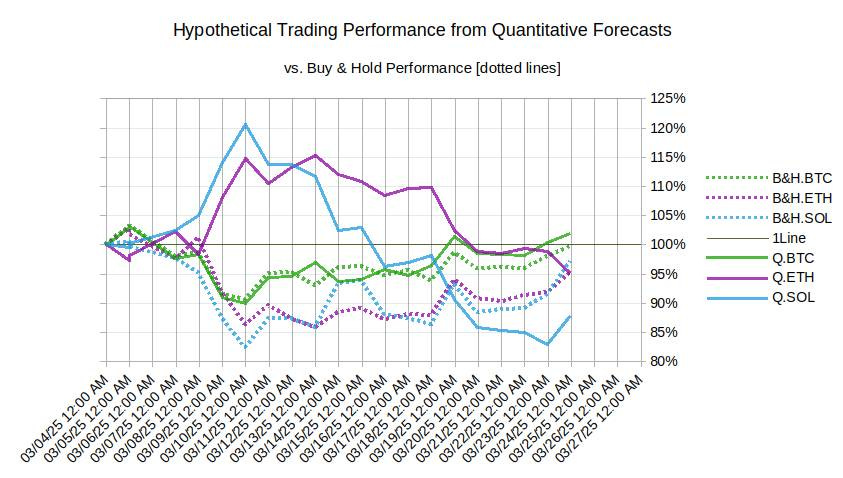
Quantitative Cryptocurrency forecasts:
Quantitative Method
Sample size: about 5 years.
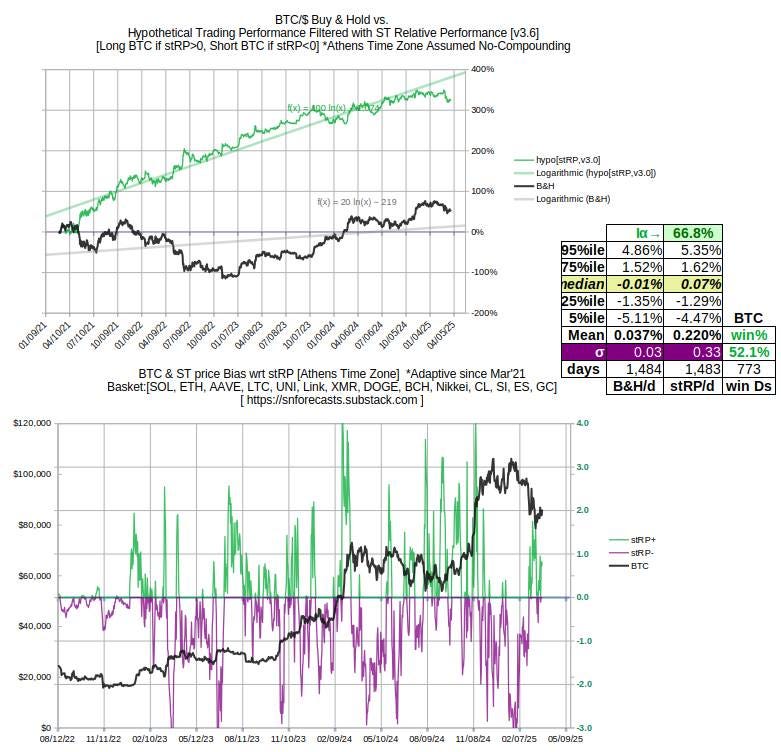
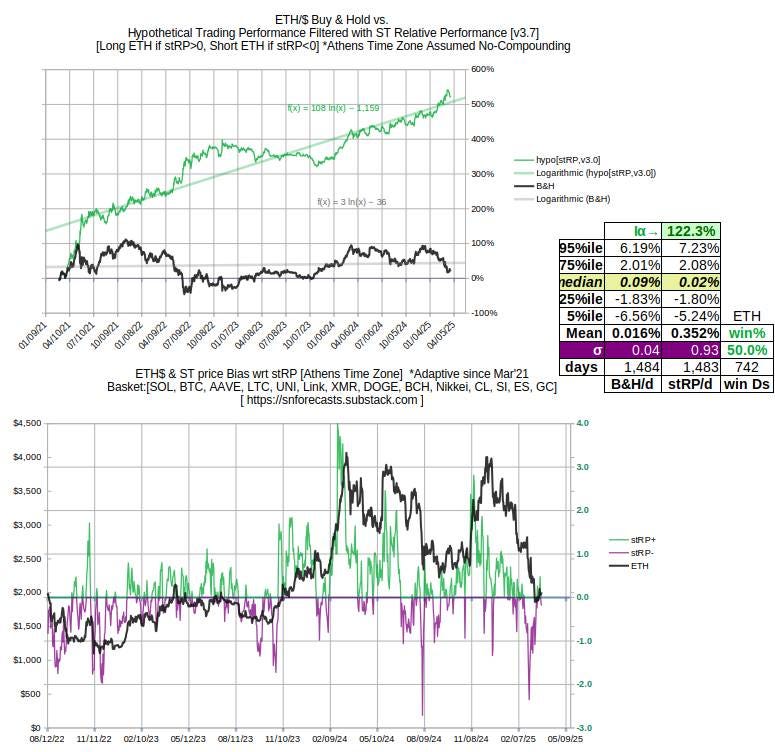
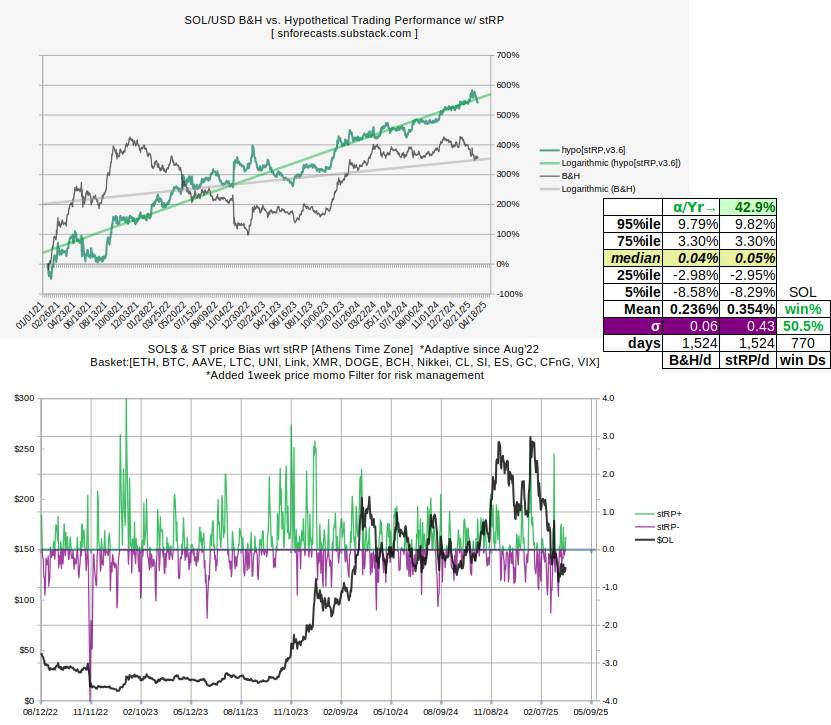
I used mostly 2 to 3 week Short Term Relative Performance (STRP) data as the independent variables here, i.e. they are the differences of the output variable performance of the past 2 to 3 weeks minus the performance of studied products.
Input / independent variables applied for STRPs:
BTC, ETH, SOL, LTC, AAVE, UNI, Link, XMR, DOGE, BCH, Nikkei, EminiS&P500(CME front month), WTI Crude Oil(NYMEX front month), Silver(COMEX active month), Gold(COMEX active month)
These ST (Short Term) forecasts are done through multiple layers of regression analysis with the historical next-day price moves of BTC, ETH, and SOL as output/dependent variables.
The aggregate forecasts are average extrapolations from the following sample windows or “layers” used to derive regression coefficients:
Full Sample
All data since 1/1/22
All data since 1/1/23
All data since 1/1/24
So we can see that the more recent periods get more weight as we move forward.
*I will be making adjustments on the applied methods, and hopefully they will improve the quality of the quantitative forecasts.
Graphic definitions
a/Yr is the back test Alpha, i.e. out/under performance against simple buy and hold, annualized, without compounding, before transaction costs.
B&H/d = historical Buy & Hold performance per day
stRP/d = back-test daily performance
95%ile gives the 95 percentile of the B&H/d and stRP/d
75%ile gives the 75 percentile of the B&H/d and stRP/d
Median gives the 50 percentile of the B&H/d and stRP/d
25%ile gives the 25 percentile of the B&H/d and stRP/d
5%ile gives the 5 percentile of the B&H/d and stRP/d
Mean gives the average daily performance of the B&H/d and stRP/d throughout the sample period.
Days: total number of days in the sample period.
Win% = percentage of the days where the quantitative strategy was net profitable.
Starting today (7th of Mar’25) bullish forecast strength will be represented by positive signal z-scores.
Starting today (7th of Mar’25) bearish forecast strength will be represented by negative signal z-scores.
Means: Average hypothetical daily P&L from quantitative forecasts
Count: Number of hypothetical trades taken from quantitative forecasts
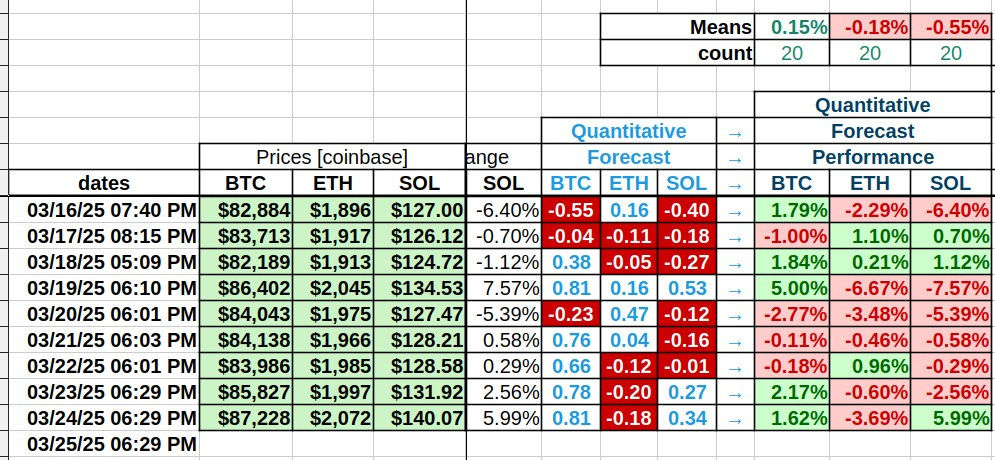
Latest Quantitative Forecasts & Performance
Updated backtest performance and stats: